
Jump to page sections
KLP AksjeNorden Indeks
Date of publishing: 2021-11-01.
I was looking for a way to invest in "Norden", Nordic countries. Being a customer of the bank/broker Nordnet, I can choose from four cheap index funds for Denmark, Finland, Norway, and Sweden. These funds have a 0.30 % total annual cost in Nordnet (only for Nordnet customers). Out of curiosity, I researched the KLP AksjeNorden Indeks mutual fund offered by KLP to see how it compared. This fund has been part of my monthly savings for a while, but I did not do proper research until tonight, and I'm now sharing the results.
The cost listed on their site is 0.18 %, while the cost at Nordnet is 0.41 %. It looks like the Nordnet fee is 0.23 %. Low cost, so this is acceptable for me, although competition is currently stiff.
I wondered if this would be an easy way to target the nordic countries. The fund has a respectable 4-star Morningstar rating. Upon checking the KIID, key information, I found that the index was VINXBNOKNI. You can see some of the companies that are in the VINXBNOKNI index here (external link to a website that I have no affiliation with, first hit in my search engine). I also found the index on Yahoo Finance, but data is missing! Link here in case it gets populated later.
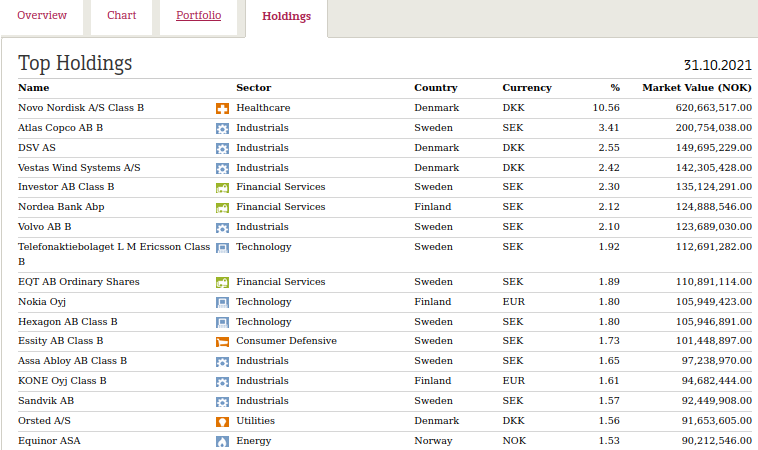
After looking around for a while, I finally found all the holdings here at this Morningstar link. When I visited this link later I got Norwegian text. To be friendly to English-speaking people I tried to add "&LanguageId=en-US" to the link - and it worked! Here is a link that should give English text.
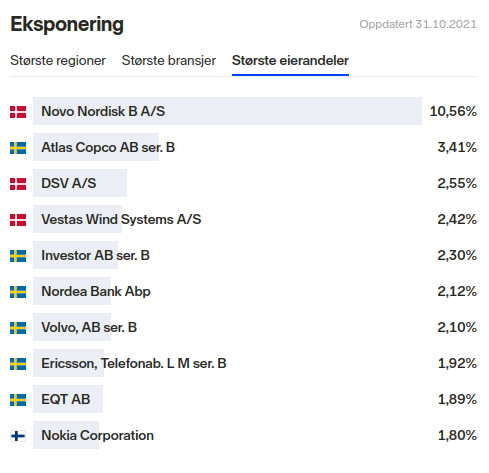
The largest holdings (all are displayed in the last link in the paragraph above):
The fund is exposed to currency fluctuations in the currencies DKK (Danish krone), EUR (Euro) and SEK (Swedish krona). The fund itself is in NOK, Norwegian krone. This makes it less attractive for international investors, of course. I do, however, speculate that NOK will strengthen itself over the coming years against "most" currencies, but don't take my word for it! I am not a fortune teller. But I believe Norway has enough of an opportunity, and the resources, to overcome the oil dependency gradually - and find new ways of making a living.
Click here for a Morningstar "investment report" I found by navigating klp.no and then tweaking the link on Morningstar to get English text.
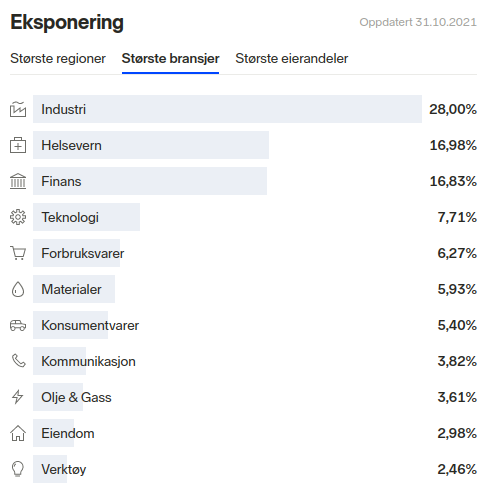
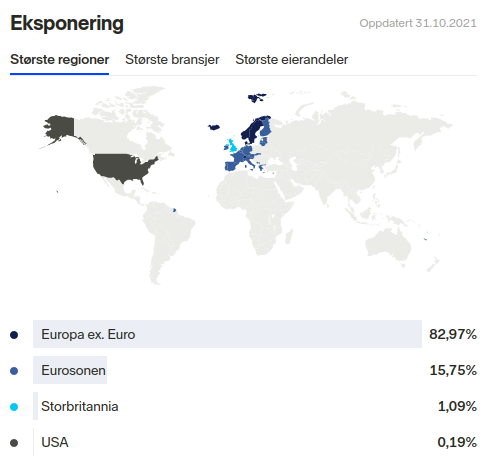
Looking at the biggest holdings in the fund, the sector distribution and the top regions, I am able to determine that as per 2021-10-31, Finland represents about 15-16 % of the investments, presumably being "the euro zone" in the overview. Excluding Great Britain and the USA, about 83 % is seemingly divided between Denmark, Norway and Sweden. I break it down into exact numbers below.
Norway is modestly represented with about 9 %. Equinor is currently the largest Norwegian holding at 1.53 %. Realizing this, getting Nordnet Indeksfond Norge in addition to KLP AksjeNorden Indeks, if you have faith in us oily Norwegians, is a good option.
Personally, I have gone with Alfred Berg Indeks Classic instead of Nordnet Indeksfond Norge lately, to target somewhat broader, as I predict the OBX (25 largest companies in OSEBX) will amount to less of the (relative) growth than the relatively small, but - as far as I know - growing, part outside the 25 giants.
The Oslo Stock Exchange has traditionally been dominated by a few large companies and some "peanut companies", but I think this will change as Norway adapts to a future with less reliance on oil. And as far as I can tell, it is already happening. I expect innovation from my fellow countryfolk. I think the Norwegian stock market has a lot to go on still.
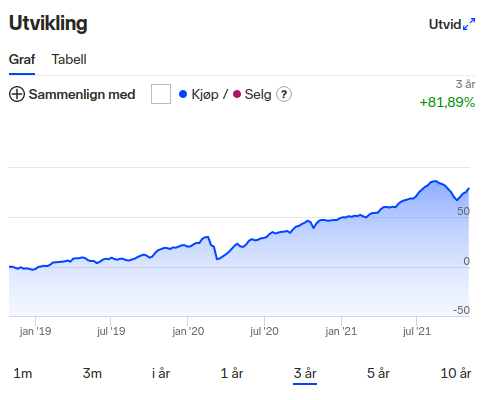
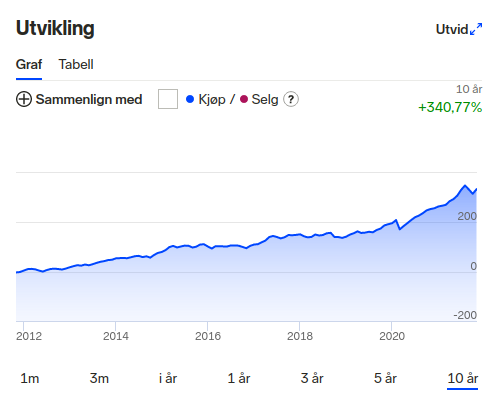
Here are a few images for a convenient overview of the fund, available in the Nordnet bank/broker for all customers. Norwegian text!
As for historical development (that we know is no absolute indicator of the future), we can see that it is up 26 % in the last year, 82 % in the last 3 years, and 341 % in the last 10 years. The fund has been around since 1999-03-16.
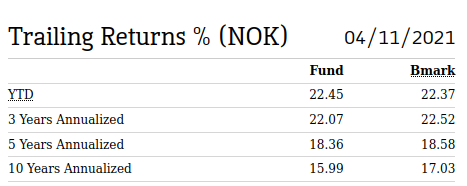
Looking at annualized (trailing) returns, the results are respectable for the last decade (but aren't they always now with QE). 15 % for the last 10 years, annualized, meaning repeated (on average) every year for 10 years, as I interpret the concept (pardon any misconception on my part!).
Pasting the table from the Morningstar link of holdings into a file and processing it with some code, I see there are 171 companies/instruments in the fund. And the total value is, as of November 2021, 5.765 billion NOK. I omitted the two bottom entries in the table with a "0"/zero value.
PS /> $klpcsv.count

171

PS /> "{0:N2} NOK" -f ($klpcsv |
measure-object -sum -prop MarketValueNOKNumerical).sum

5,765,419,921.00 NOK
Using some other code, I could break it down into countries:
PS /> $klpcsv |
group-object -Property country |
Sort-Object -desc count


Count Name           Group
----- ----           -----
   90 Sweden         {@{Name=Atlas Copco AB B ; Sector
   28 Finland        {@{Name=Nordea Bank Abp ; Sector
   27 Norway         {@{Name=Equinor ASA ; Sector
   22 Denmark        {@{Name=Novo Nordisk A/S Class B
    1 Iceland        {@{Name=Marel hf ; Sector
    1 Switzerland    {@{Name=ABB Ltd ; Sector
    1 United Kingdom {@{Name=AstraZeneca PLC ; Se
    1 United States  {@{Name=Millicom International Cellular SA SDR
Using some slightly more sophisticated code, I can easily break it down into how much is invested in which country:
PS /> $klpcsv |
group-object -Property country |
>> Sort-Object -desc count | foreach {
>> [pscustomobject]@{ Count = $_.Count
Country = $_.Name; Sum = "{0:N0}" -f (
$tempsum = ($_.group |
Measure-Object -Sum -Property MarketValueNOKNumerical).Sum
); "%" = "{0:N2}" -f ($tempsum/$totalinvestedamount*100) } }


Count Country        Sum           %
----- -------        ---           -
   90 Sweden         2,577,529,143 44.71
   28 Finland        908,203,290   15.75
   27 Norway         539,064,073   9.35
   22 Denmark        1,605,502,017 27.85
    1 Iceland        13,868,693    0.24
    1 Switzerland    47,646,703    0.83
    1 United Kingdom 62,698,054    1.09
    1 United States  10,907,948    0.19
As we can clearly see, Sweden is dominant, then come the Danes, Finns, and finally us Norwegians. But the number of companies for Denmark, Finland and Norway is similar. Sweden has more companies represented than the rest of the nordic countries combined.
I realized the task of breaking down the data in the fund could be automated. Easily broken since it is based on parsing HTML with regex, as all developers know is a terrible wrong-doing, but it works for now. I am offering this script for sale (10 USD or 89 NOK). If interested, you can read more about it here (using a computer/PC/desktop rather than a mobile phone is recommended, at least a tablet).
My conclusion is that this is an acceptable fund to include in my monthly savings/investments. It's up to you to judge for yourself.
Finance Finans Powershell FintechBlog articles in alphabetical order
A
- A Look at the KLP AksjeNorden Index Mutual Fund
- A primitive hex version of the seq gnu utility, written in perl
- Accessing the Bing Search API v5 using PowerShell
- Accessing the Google Custom Search API using PowerShell
- Active directory password expiration notification
- Aksje-, fonds- og ETF-utbytterapportgenerator for Nordnet-transaksjonslogg
- Ascii art characters powershell script
- Automatically delete old IIS logs with PowerShell
C
- Calculate and enumerate subnets with PSipcalc
- Calculate the trend for financial products based on close rates
- Check for open TCP ports using PowerShell
- Check if an AD user exists with Get-ADUser
- Check when servers were last patched with Windows Update via COM or WSUS
- Compiling or packaging an executable from perl code on windows
- Convert between Windows and Unix epoch with Python and Perl
- Convert file encoding using linux and iconv
- Convert from most encodings to utf8 with powershell
- ConvertTo-Json for PowerShell version 2
- Create cryptographically secure and pseudorandom data with PowerShell
- Crypto is here - and it is not going away
- Crypto logo analysis ftw
D
G
- Get rid of Psychology in the Stock Markets
- Get Folder Size with PowerShell, Blazingly Fast
- Get Linux disk space report in PowerShell
- Get-Weather cmdlet for PowerShell, using the OpenWeatherMap API
- Get-wmiobject wrapper
- Getting computer information using powershell
- Getting computer models in a domain using Powershell
- Getting computer names from AD using Powershell
- Getting usernames from active directory with powershell
- Gnu seq on steroids with hex support and descending ranges
- Gullpriser hos Gullbanken mot spotprisen til gull
H
- Have PowerShell trigger an action when CPU or memory usage reaches certain values
- Historical view of the SnP 500 Index since 1927, when corona is rampant in mid-March 2020
- How Many Bitcoins (BTC) Are Lost
- How many people own 1 full BTC
- How to check perl module version
- How to list all AD computer object properties
- Hva det innebærer at særkravet for lån til sekundærbolig bortfaller
I
L
M
P
- Parse openssl certificate date output into .NET DateTime objects
- Parse PsLoggedOn.exe Output with PowerShell
- Parse schtasks.exe Output with PowerShell
- Perl on windows
- Port scan subnets with PSnmap for PowerShell
- PowerShell Relative Strength Index (RSI) Calculator
- PowerShell .NET regex to validate IPv6 address (RFC-compliant)
- PowerShell benchmarking module built around Measure-Command
- Powershell change the wmi timeout value
- PowerShell check if file exists
- Powershell check if folder exists
- PowerShell Cmdlet for Splitting an Array
- PowerShell Executables File System Locations
- PowerShell foreach loops and ForEach-Object
- PowerShell Get-MountPointData Cmdlet
- PowerShell Java Auto-Update Script
- Powershell multi-line comments
- Powershell prompt for password convert securestring to plain text
- Powershell psexec wrapper
- PowerShell regex to accurately match IPv4 address (0-255 only)
- Powershell regular expressions
- Powershell split operator
- Powershell vs perl at text processing
- PS2CMD - embed PowerShell code in a batch file
R
- Recursively Remove Empty Folders, using PowerShell
- Remote control mom via PowerShell and TeamViewer
- Remove empty elements from an array in PowerShell
- Remove first or last n characters from a string in PowerShell
- Rename unix utility - windows port
- Renaming files using PowerShell
- Running perl one-liners and scripts from powershell
S
- Sammenlign gullpriser og sølvpriser hos norske forhandlere av edelmetall
- Self-contained batch file with perl code
- Silver - The Underrated Investment
- Simple Morningstar Fund Report Script
- Sølv - den undervurderte investeringen
- Sort a list of computers by domain first and then name, using PowerShell
- Sort strings with numbers more humanely in PowerShell
- Sorting in ascending and descending order simultaneously in PowerShell
- Spar en slant med en optimalisert kredittkortportefølje
- Spre finansiell risiko på en skattesmart måte med flere Aksjesparekontoer
- SSH from PowerShell using the SSH.NET library
- SSH-Sessions Add-on with SCP SFTP Support
- Static Mutual Fund Portfolio the Last 2 Years Up 43 Percent
- STOXR - Currency Conversion Software - Open Exchange Rates API